


Brno, Czech Republic, is home to the world’s largest Red Hat technology center, and it was the birthplace of the university-industry relationship model that became Red Hat Research. Here’s how the smart city concept has been implemented in one of our hometowns. The article stems from a presentation at DevConf.cz 2022.
To flourish in an ever-changing world, cities need to increase their use of urban data. Municipalities all across the globe are following this trend, and the city of Brno is no exception. Geographic information systems (GIS) and spatial data help form the backbone of our city’s decision making and policy planning. Additionally, our urban open data platform allows the city and the general public to use the data. Without these components, we would not be able to deliver the high-quality services and great quality of life Brno is famous for.
Our city collects and maintains millions of data entries each day. They vary widely, ranging from greenery to traffic data to population data. Most of the data collected have a spatial dimension and are best maintained in the GIS, which we use throughout the urban environment. The city itself, city companies, city districts, and all publicly funded entities use a single GIS. This allows for efficient data sharing across the organizations and robust utilization of the data for both day-to-day management and strategic planning and policymaking.
Open data is one of the fundamental pillars of our smart city concept.
On top of the GIS sits the urban open data platform data.brno.cz, which serves as an entry point for anyone from the public to download or incorporate city data into their projects or systems. As part of promoting transparency and openness, we have also begun to emphasize publishing data using open data standards. Open data is one of the fundamental pillars of our smart city concept.
This means that data is published in a machine-readable format, free of license restrictions, and easily accessible. Most of them are continuously updated, and all have complete metadata. We provide around 150 datasets this way.
Transit
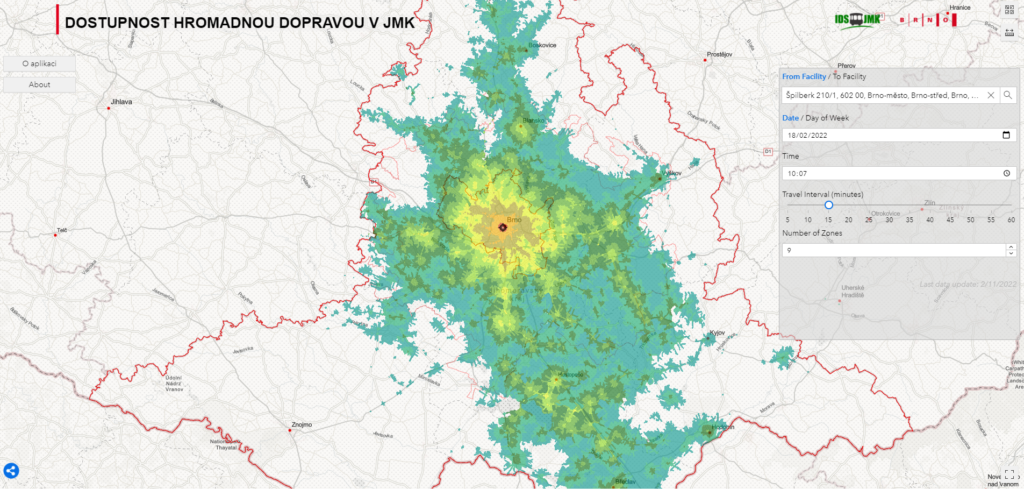
One of the use cases we are most proud of is an app that creates accessibility models of our region by public transit using general transit feed specification (GTFS) data. The application is used primarily by traffic planners to identify how different parts of a city or region are doing in terms of accessibility. They can detect areas with better or worse accessibility by public transit and get a quick and easy comparison with other areas. This insight is then used in planning to ensure better accessibility, connectivity, and efficiency for the whole system.
However, the application is also accessible to the general public. It can be used, for example, to select locations when looking for new housing so that it is possible to get to work or school in a specific time interval. The application can also serve private companies who need to better understand the transportation context of a location and compare the connectivity of different parts of the city or region.
Climate change
Another app built with the help of our data is the map of photovoltaic potential, which visualizes how much sunlight falls across the whole city. The detailed map allows citizens to identify their rooftops’ potential for installing photovoltaic panels.
Brno has a comprehensive plan to build solar panels on city-owned buildings, and the app allows the environmental department to identify and assess where they would deliver the best returns. Together with a thermal map used for better tree planting, it is one of the supporting tools we use to combat climate change.
Recycling and waste management
We have also developed a walking accessibility model that visualizes how long it takes to get to the nearest container for recyclables. The model contains three zones (for one, two, or three minutes of walking) and is constructed for each type of recyclable, such as paper or plastic.
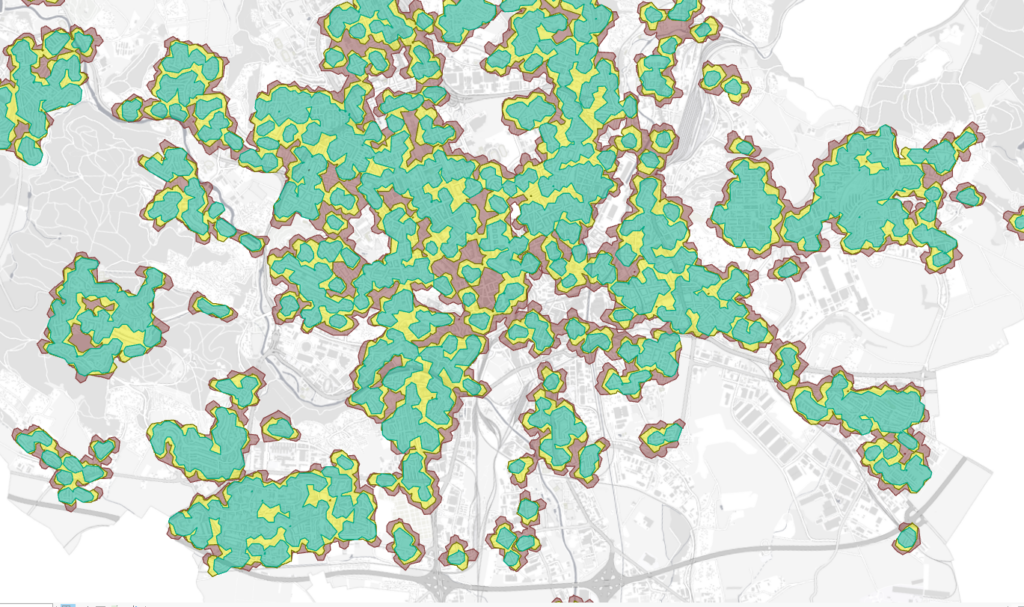
The model is updated daily, allowing our colleagues in the environmental department to assess the efficiency of the complete network and propose changes. Our goal is to get to a state where no one need walk more than three minutes to get to the needed container; later, we would like to reduce that to two minutes.
Traffic
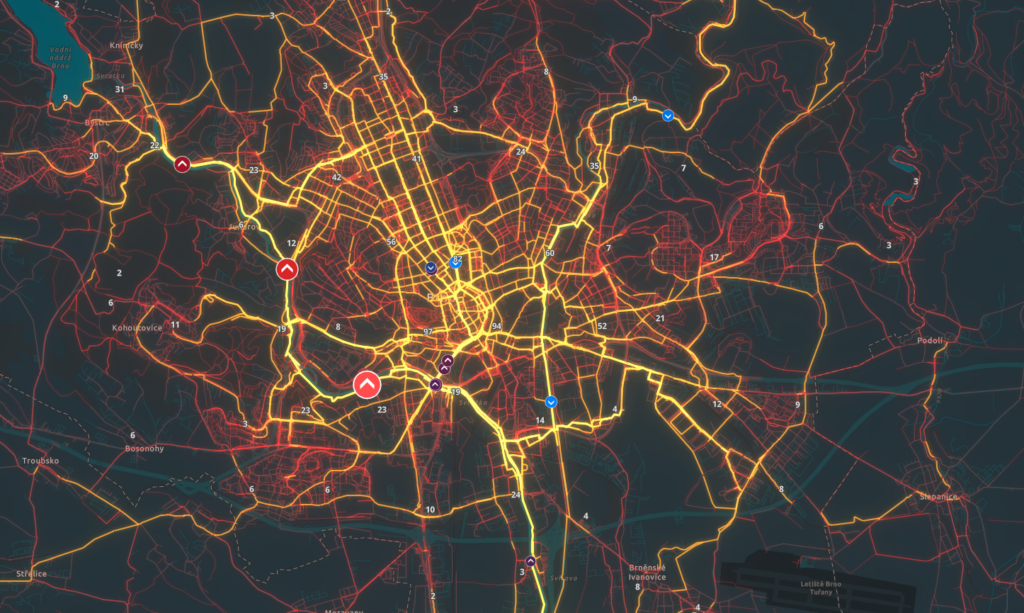
Whether for bikes, cars, or any other type of vehicle, we collect traffic data and use it extensively. For example, every major intersection in our city collects the number of cars in real time. This way, we know what will happen if we close some streets and can prevent or at least mitigate traffic jams. The model is enhanced by Waze near-real-time data feeds, including current road events or traffic speeds, which we get as a partner of the Waze for Cities program. We also collect the public transit positional data, which, for example, allows transit vehicles to get preferential access at traffic lights. We expect heavy utilization of this data by the public, as we’ve received many requests.
Our transportation department also collects bike traffic intensity data from several sources. We have bike traffic intensity sensors on the major cycling thoroughfares and get the data from a “Bike to work” event, where thousands of people record their daily trips to work for the entire month of May. The Strava app provides recreational biking data, and we also survey the streets every two years. All this biking data is then used to plan new cycle lanes and paths and assess the current ones. Most of this data can be found in the bike traffic intensity data app.
Parking data is a vital part of traffic data. We maintain huge swaths of parking data, ranging from specific allocated parking spots through parking meters to real-time car park capacity data. The data is used in policy planning for the regulated parking system that covers almost the whole of the city. We recently opened the data to the general public, and several companies already utilize it in their navigational apps or systems.
In the very near future, we plan to publish the positional data of our garbage trucks so that navigation companies such as Waze or Garmin can display them in their systems. This will help drivers save time by avoiding streets with traffic jams caused by garbage trucks, as many of our streets are exceptionally long and narrow.
Public data access
These are only some of the ways data is used to make Brno a healthier, happier city. There is a wide range of valuable applications that can be built on top of city data to improve the environments we live in. Publishing those data using high-quality open data standards can further their impact and will eventually introduce new tools or apps that make the lives of citizens easier and more sustainable.
Although the examples given here reflect the Brno region at a very local level, all of the results are replicable in other cities as well since we use only worldwide standards and software solutions. The best part is that if you would like to test and try out some of your ideas and your city doesn’t provide the data you are looking for, you can always try ours! Everything discussed above is published in an open format on data.brno.cz, and it is also in English.