


Passive network latency monitoring offers a more holistic view of network performance without creating additional traffic. Researchers are developing a new tool to enable it efficiently.
Network latency is a determining factor in users’ Quality of Experience (QoE) for applications including web searches, live video, and video games. That’s why network latency monitoring is critical. Monitoring latency makes it possible to find problems and optimize the network proactively, and it has a wide range of other use cases, such as verifying Service Level Agreements (SLAs), finding and troubleshooting network issues such as bufferbloat, making routing decisions, IP geolocation, and detecting IP spoofing and BGP routing attacks.
See “Programmable networking project reports on its first year of progress” in RHRQ 3:3 (Nov. 2021)
Since 2020, our collaborative programmable networking research team at Karlstad University in Sweden has explored the potential of eBPF in the Linux Kernel to alleviate several problems with latency monitoring. This led to the development of epping, a tool that leverages eBPF to passively monitor the latency of existing network traffic. In this article, we present some of the insights gained from this project so far and the future directions we plan to take this research.
What is passive latency monitoring?
While active network monitoring, like ping, is useful for measuring connectivity and idle network latency in a controlled manner, it cannot directly infer the latency application traffic experience. Network probes may be treated differently from application traffic by the network, for example, due to active queue management and load balancing, and therefore their latency may also differ. Furthermore, many active monitoring tools require agents to be deployed directly on the monitored target, which is not feasible for an ISP wishing to monitor the latency of its customers.
By contrast, passive monitoring techniques observe existing application traffic instead of probing the network. This means passive monitoring can run on any device on the path that sees the traffic, not only at the endpoints. In this project, we have implemented a passive monitoring solution that extends the functionality of the original Passive Ping (pping) utility and adapts it to use the eBPF technology that is part of the Linux kernel. eBPF adds the ability to attach small programs to various hooks that run in the kernel, making it possible to inspect and modify kernel behavior in a safe and performant manner. eBPF is generally well suited for monitoring events in the kernel, including processing network traffic, and is thus a nice fit for passive latency monitoring.
The utility we have developed, evolved Passive Ping (epping), is an open source utility that runs on any Linux machine and can monitor the latency of TCP and ICMP traffic visible to the machine. That means traffic originating from the local host as well as traffic passing through the host when it is deployed as a middlebox, either standalone or as a container or virtual machine host.
Results from an epping measurement study
To evaluate the performance of epping in a real-world environment, we set up a measurement study to collect measurements from within the core network of JackRabbit Wireless, a wireless ISP operating in El Paso, Texas, USA. JackRabbit serves approximately 400 subscribers, of which around 95 % are households. JackRabbit relies on fixed wireless connections for both access and backhaul networks. Once traffic reaches the core router at JackRabbit’s central site, it is routed through a middlebox/bridge running LibreQoS, an open source QoE platform for ISPs. The bridge applies fair queuing, active queue management, and shaping to provide a good QoE for each customer, and also serves as our measurement point where we deployed epping. Measurements were gathered without impacting the forwarding capabilities of the machine: the overhead of running epping was low enough that the machine in question could still serve the offered load.
Latency variation
The selected measurement point enables us to capture and analyze all traffic going in and out of the ISP network and to look at the traffic in both the internal (customer-facing) and external parts of the network. This allows us to examine how the latency varies over time in both directions. Figure 1 shows one week of data from the total one-month measurement period.
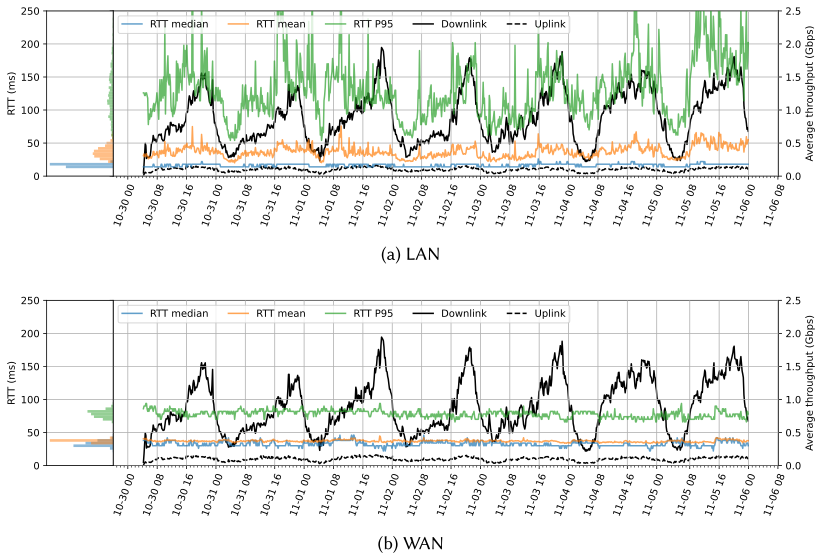
The figure includes information on the traffic load, making it possible to examine its potential correlation with latency. The uplink and downlink traffic loads (right y-axis) show a very clear diurnal behavior, with downlink traffic peaks of up to around 2 Gbps around 20:00-22:00 in the evening, then drops down to a few hundred Mbps between 02:00-05:00 in the morning. The mean and 95th percentile RTTs on the Local Area Network (LAN) side vary over time, while the median appears more stable. Furthermore, the mean and 95th percentile RTTs appear to be partly correlated to the traffic load, where they also appear to be higher during the afternoon and evening and lower during the night and early morning. In contrast, the RTTs on the Wide Area Network (WAN) side do not show any significant variations over time.
The most likely culprit for the latency increase on the LAN side is the WiFi link at the subscriber’s premises. The RTTs in the measurement study are likely mainly collected for traffic from portable devices connected via WiFi. It is well known from previous work that the WiFi hop often makes up a substantial part of the end-to-end latency and that its latency can increase drastically when it becomes the bottleneck link or when many devices are competing for access. During busy hours, the radio spectrum is also more congested, with the wireless links facing more interference and concurrent access. This, in turn, leads to a higher probability of packet errors and collisions, which are translated into more retransmissions and backoff periods on the link layer and, thus, additional latency. A congested radio spectrum could also impact latency in the ISP wireless access network, not just inside customer homes.
Subnet traffic analysis
Another interesting property of the traffic we can analyze using epping is the variation in latency between different destinations on the internet. This is possible because epping captures traffic metrics on a per-subnet basis (in /24 address blocks in this measurement regiment). In Figure 2, we further aggregate this into /8 blocks, allowing us to visualize the entire public (IPv4) address space at once.
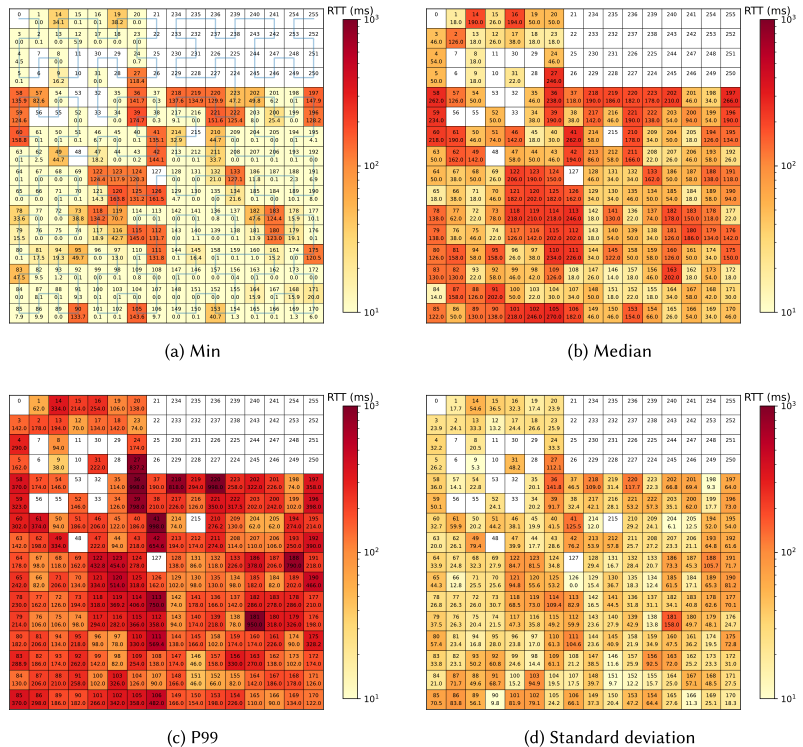
The figure layout is inspired by the xkcd “Map of the Internet,” and the map layout follows a Hilbert curve to situate numerically consecutive address blocks close to each other. The upper number in each block shows the number of the block (e.g., 42 is 42.0.0.0/8), and the lower value shows the RTT in ms.
While most /8 blocks may contain traffic to a multitude of services and organizations, there are still some clear differences in the RTT statistics between the different /8 blocks. Furthermore, several of the blocks showing higher RTTs are clustered together. Looking at the minimum latency, in particular, it is interesting that it identifies blocks that do not appear to have any nearby Points of Presence (PoPs). We can see that, among others, the blocks 27, 36, 39, 41-42, 58-60, many in 111-126, 196-197, and 218-222 show minimum RTTs well above 100ms. This largely corresponds to blocks managed by the Asia Pacific Network Information Centre (APNIC) and African Network Information Centre (AFRINIC) and, thus, likely primarily hosted in the Asian and African regions. Tail latency in the 99th percentile follows similar patterns as the minimum and median RTT, with mostly the same APNIC and AFRINIC blocks having the highest values. However, some blocks with low median RTT, such as 13, 31, 65, and 103, show a large relative increase in 99th percentile RTT, roughly an order of magnitude. This indicates that the RTTs in these blocks have a long tail, even if the absolute RTT values are not that high.
While this analysis does not directly allow us to infer the sources of higher latencies, an overview of the entire networking space like the one above can be useful to understand the traffic originating from a particular network and can be used to initiate further analysis to determine the root cause and optimize network behavior.
Plans for future work
As can be seen in the examples from the measurement study outlined above, with epping it is feasible to run a longitudinal analysis of the latency behavior of an entire network and extract detailed data that can be used to optimize the network. This serves as a proof-of-concept of the tool itself, and the measurements themselves also provide an interesting insight into real-world network behavior at an ISP.
We extended our collaboration in 2023, and over the next two years, we plan to build on this work to expand the capabilities of the epping utility and incorporate ideas from it into Red Hat products. In particular, we plan to incorporate the passive latency monitoring capabilities of epping to enable the same kind of analysis of egress cluster traffic showcased above. In addition, we will work on enhancing the capabilities of epping itself so that it is more readily deployable as a standalone monitoring and measurement tool. This includes working on enhanced reporting capabilities, extending its coverage to additional protocols such as QUIC, and new features based on the feedback from the study excerpted above.