


This is the third of a series of three articles about the formal analysis and verification of the real-time Linux kernel.
Scheduling latency is the principal metric of the real-time variant of Linux, and it is measured using the cyclictest tool. Despite its practical approach and contributions to the current state of the art of real-time Linux, cyclictest has some known limitations. The main constraint arises from the opaque nature of the latency value provided by cyclictest. The tool only provides information about the latency value, without providing insights on its root causes. This fact, along with the absence of a theoretically sound description of the in-kernel behavior, raises some doubts about whether Linux can really support the “real-time” description.
A common approach in real-time systems theory is categorizing a system as a set of independent variables and equations that describe its integrated timing behavior. The first article of this series (see RHRQ 2:3) presented the thread synchronization model, which is composed of a set of formal specifications that define the behavior of the system. This article leverages the specifications of that model to discover a safe bound for the scheduling latency of Linux. It also uses findings from the second article of this series (see RHRQ 2:4), in which an efficient verification tool was developed, by using the same method to capture the values for variables that compose the scheduling latency on a real system and identify the root cause of high latency values.
From informal to formal
The latency experienced by a thread instance is, informally, defined as the maximum time elapsed between the instant in which it becomes ready while having the highest priority among all ready threads and the instant in which it is allowed to execute its own code after the context switch has already been performed.
A common approach in real-time systems theory is categorizing a system as a set of independent variables and equations that describe its integrated timing behavior. The first step in this approach is to define the task model of the system. In this work, the task model is composed of three levels of tasks: the NMI, the IRQs, and the threads. The system has a single NMI, a set IRQ = {IRQ1, IRQ2, …} of maskable interrupts, and a set of threads τ = { τ1, τ2, … }. The NMI, IRQs, and threads are subject to a scheduling hierarchy in which NMI always has a higher priority than IRQs, and IRQs always have higher priority than threads.
Given a threadτi at a given point in time, the set of threads with a higher priority than τ1 is denoted by HP(τi). Similarly, the set of tasks with priority lower than τi is denoted by LP(τi). From the τithread perspective, all IRQs and the NMI belong to HP(τi). Although the schedulers might have threads with the same priority in their queues, only one among them will be selected to have its context loaded and, consequently, start running. Hence, when scheduling, the schedulers elect a single thread as the highest priority one, with all other active threads belonging to LP(τi).
The tasks can also influence one another via synchronization primitives. For example, a thread can postpone the execution of an IRQ by temporarily masking interrupts, or it can defer the execution of another thread in HP(τi) by temporarily disabling the preemption. Moreover, the scheduling operation itself influences the thread execution timeline because it is not an atomic operation.
The complexity imposed by the different levels of tasks, the synchronization primitives, and the overhead involved in Linux threads’ scheduling makes informal language inadequate for this analysis. A formal thread synchronization model is required instead. The model, which enables the composition of specifications using a deterministic format, removes the ambiguity of natural language while enabling reasoning about the system in a more analytical manner.
In this work, we have translated the specifications of the thread synchronization model into a set of properties. We then leverage these properties in an analysis that derives a theoretically sound bound for scheduling latency.
A theoretically sound bound for scheduling latency
The scheduling latency experienced by an arbitrary thread τi in τ is the longest time elapsed between the time A, in which any job of τi becomes ready and has the highest priority, and the time F, in which the scheduler returns and allows τi to execute its code, in any possible schedule in which τi is not preempted by any other thread in the interval [A, F]. We begin determining which types of entities may prolong the latency of τi.
In real-time theory, any time a task in LP(τi) delays τi, τi is said to be blocked. When the task delaying τi is in HP(τi), τi is said to be suffering interference. These two forms of delay were analyzed separately, starting with the blocking. Each of these forms of delay was characterized by variables and equations whose definition supports the model. The main specification used in the definition of the latency bound is shown in Figure 1.
Blocking time
Blocking time (referred to as interference-free latency in the original paper) is characterized with the following equation1:
LIF ≤ max(DST, DPOID) + DPAIE + DPSD
Where:
- L means the scheduling latency
- IF means interference free
- D means the delay of
- ST: the sched tail delay, which is the delay from the IRQs being disabled to cause the context switch, and the return from the scheduler
- POID: the longest preemption or IRQ disabled to postpone the scheduler
- PAIE: the longest time in which the preemption and IRQs are transiently enabled in the return of the preemption or IRQ enable, that will cause the scheduler execution to preempt the current thread
- PSD: the longest time in which the preemption is disabled to execute __schedule() function.
It is worth noting that a blocking delay is only caused by other threads, which by definition belong to the sets of lower priority tasks LP(τi). The delay caused by IRQs and NMI is all accounted for as interference.
Interference
Because there is no single way to characterize these workloads, defining the interference caused by the NMI and IRQs presents a challenge. So instead of defining a single best way to compute interference from interrupts, the interference from IRQs and NMI was defined as two functions in the theorem that define the latency. The function can then be selected according to the more accurate representation of the system.
The latency bound
The scheduling latency is then defined as the sum of blocking time and interference time, as in the following equation. The L in both sides of the equation is resolved by solving the equation until it converges on both sides.
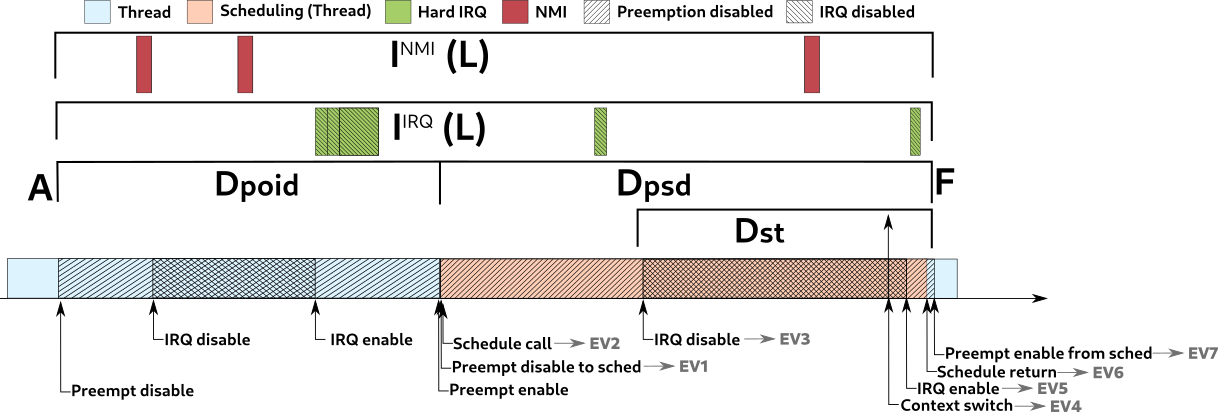
L = max(DST, DPOID) + DPAIE + DPSD + INMI(L) + IIRQ(L)
Figure 2 shows these variables in a timeline format, helping to illustrate the composition of the latency from A to F.
Rtsl: a latency measurement tool
As shown in the first article, it is possible to observe the thread synchronization model’s events using Linux’s tracing features. The obstacle is that the simple capture of these events using trace causes a non-negligible overhead in the system, both in CPU and memory bandwidth, representing a challenge for measuring variables in the microseconds scale. However, as demonstrated in the second article, it is possible to process these events in-kernel, reducing overhead. In this article, an efficient verification method was leveraged to develop the real-time latency measurement toolkit named rtsl. The toolkit architecture is presented in Figure 3.
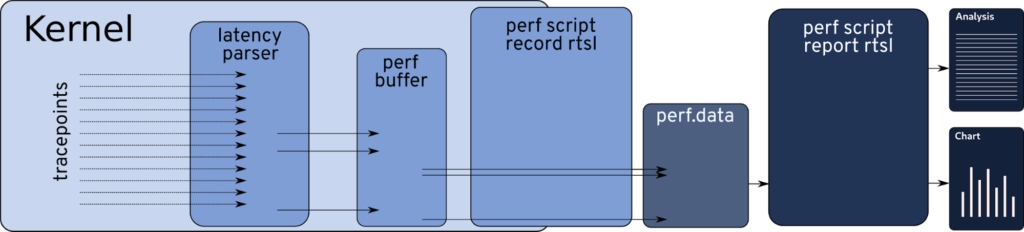
The latency parser is a kernel module that uses the thread synchronization model’s kernel tracepoints to observe their occurrence from inside the kernel. The latency parser registers a callback function to the kernel tracepoints. The callback functions then pre-process the events, transforming them into one of the variables presented in Figure 2, only exporting them to the trace buffer when necessary. This reduces the overhead enough to enable the usage of the tool for measurements. For example, the record of these values adds only around two microseconds to the cyclictest measurements when compared to the same system running without trace.
As mentioned in the interference section above, there is no single best way to account for the delay caused by interrupts. Instead of proposing a single function to account for the interference, the rtsl toolkit processes the data from an interrupt using different functions, reporting the hypothetical result from each of them. Examples of functions are considering interrupts as periodic or using the sliding window algorithm, as shown in the experiments section below.
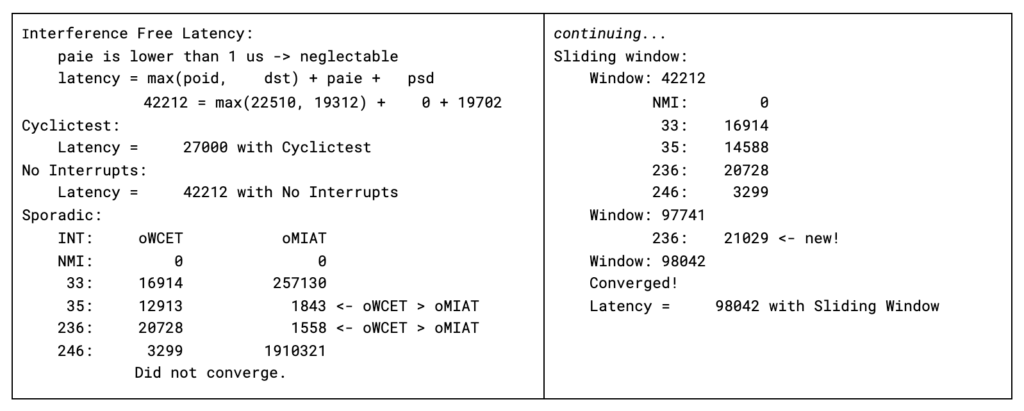
The processing of the data is done in user space, using perf as the interface. Perf is used to capture, store, and process the data in user space. The processing phase, named report, produces both graphical and textual output. The textual output shows the value for each of the variables that compose the latency and the hypothetical latency for each given interrupt function. An example of the output is shown in Figure 4.
The textual output serves to identify how much each variable contributes to the scheduling latency. This evidence can be used then to trace the specific variable, in such a way to identify the root cause of bad values. An example of this procedure is shown in the original paper.
Experiments
This section presents some latency measurements, comparing the results found by cyclictest andperf rtsl while running concurrently in the same system. The experiments were executed on two systems: a workstation and a server. The Phoronix test suite benchmark was used as a background workload to exercise different parts of the system. One sample of the results of the experiments is shown in Figure 5. The workload of each experiment is explained in the legend. The colored columns represent the different metrics. The first is cyclictest, the second is the interference-free latency, and the next four are the hypothetical latency based on the given interrupt interference function from rtsl. Consistently, the proposed approach found sound scheduling latency values higher than cyclictest could find in the same time frame. Considering interference curves such as the sliding window, the latency values are still in the microseconds scale, even on non-tuned general purpose hardware. When considering the highly pessimistic sliding window with oWCET (observed worst-case execution time)interference, the latency is bound to the single digit milliseconds, enough to justify Linux on a vast set of safety-critical use cases.
Final Remarks
Usage of real-time Linux in safety-critical environments, such as in the automotive and factory automation field, requires a set of more sophisticated analyses of both the logical and timingbehavior of Linux. In this series of articles, we presented a viable approach for the formal modeling, verification, and analysis of the real-time preemption mode of Linux. The definition of the latency bound was the primary goal of this research. However, the complexity of Linux required the support of a formal language to abstract the complexity of the code and the development of an efficient way to monitor the relevant events. With the bases set, the mathematical reasoning about the kernel behavior was evident, resulting in an analysis accepted by the academic community, who raised this limitation of Linux more than a decade ago.
In addition to the evident results, such as the efficient runtime verification and the mathematical demonstration of the bound of the scheduling latency, this research is motivating the development of new methods for Linux analysis. Examples of ongoing research range from the usage of temporal language for runtime verification to the application of probabilistic methods for the definition of values for the variables that compose the timeline of tasks on Linux. More details about the “Demystifying the real-time Linux scheduling latency” paper are available at bristot.me/demystifying-the-real-time-linux-latency/.
1The development of the equations are not presented here because of space constraints. Please refer to the original paper for further information: “Demystifying the real-tIme Linux scheduling latency,” presented in the 32nd Euromicro Conference on Real-Time Systems (ECRTS 2020).