


Research on the root causes of OS noise in high-performance computing environments has produced a tool that can provide more precise information than was previously available.
The Linux operating system (OS) has proved to be a viable option for a wide range of very niche applications, despite its general-purpose nature. For example, Linux can be found in the high-performance computing (HPC) domain, running on all the TOP500 supercomputers, as well as the embedded real-time systems domain. These achievements are possible because Linux has such great configuration flexibility.
Linux is central in developing the core services that support modern networking infrastructures and the internet with Network Function Virtualization (NFV) and Software-Defined Networking (SDN). The 5G network stack is built on this paradigm, enabling a new set of services characterized by strict timing requirements, on the order of 10s of microseconds.
To meet these tight timing requirements, hardware and Linux are configured according to standard practices from the HPC and real-time domains. To this end, the hardware is set to achieve the best trade-off between performance and determinism. The OS is usually partitioned into isolated and housekeeping CPUs. The housekeeping CPUs are those where the tasks necessary for regular system usage will run. This includes kernel threads responsible for in-kernel mechanisms, such as RCU callback threads; kernel threads that perform deferred work, such as kworkers; and threads dispatched by daemons and users. The general system’s interrupt requests (IRQs) are also routed to housekeeping CPUs. This way, the isolated CPUs are then dedicated to NFV work.
NFV applications run either by being triggered by an interrupt or by polling the network device while waiting for packets, running nonstop. While the first case has been extensively studied (for example, in “Demystifying real-time Linux scheduling latency,” RHRQ 3:1), this is not the case for the interference suffered by polling threads.
The paper “Operating system noise in the Linux kernel” contributes to this end by:
- Proposing a precise definition of the causes of OS noise in Linux from a real-time perspective
- Presenting a kernel tracer that can measure OS noise using the workload approach, while also providing tracing information essential to pinpoint tasks suffering from OS noise, not only that caused by the OS but also noise from the hardware or the virtualization layer
- Reporting on empirical measurements of OS noise from different configurations of Linux commonly found in NFV setups, showing how the tool can be used to find the root causes of high-latency spikes, thus enabling finer grained tuning of the system
Operating system noise
OS noise is a well-known problem in the HPC field. Generally, HPC workloads follow the single-program multiple-data (SPMD) model, shown in Figure 1. In this model, a system is composed of M processors, and a parallel job consists of one process per processor. All processes are dispatched simultaneously at the beginning of the execution. At the end of execution, the process synchronizes to compose the final work and repeats cyclically. Ideally, the parallel job process should be the only workload assigned to the processor. However, some operating system-specific jobs need to run on all processors for the correct operation of the system, like the periodic scheduler tick, critical kernel threads, or others. In this scenario, each local processor’s scheduler decisions significantly impact a parallel job’s response time. With this background, we can now define OS noise as all the time spent by a CPU executing instructions not belonging to a given application task assigned to that CPU while the task is ready to run.
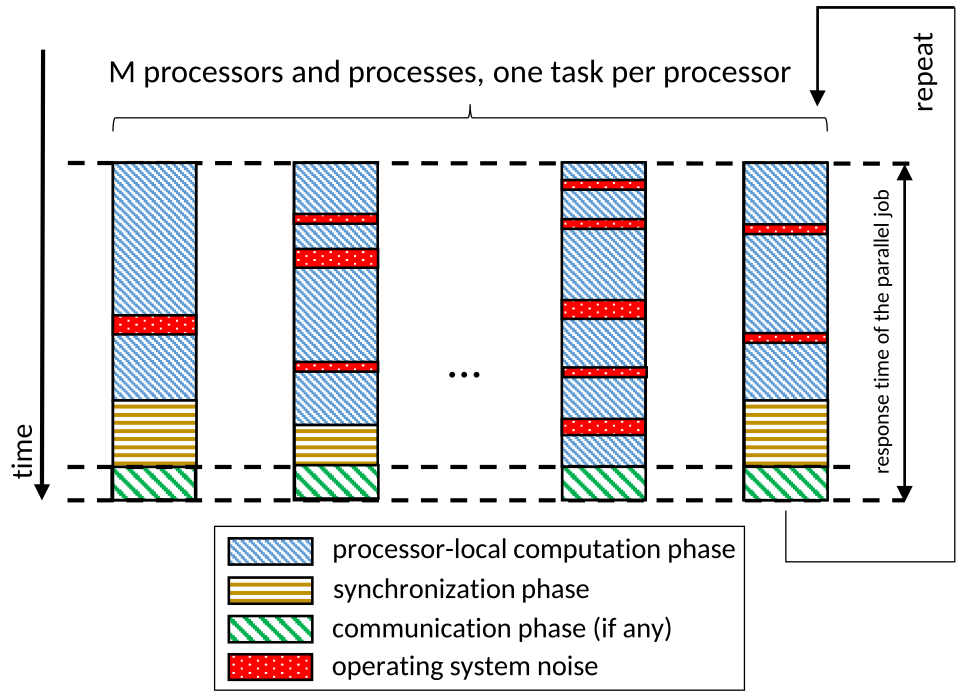
Figure 1. The single-program multiple-data (SPMD) model used for HPC workloads
and the effects of the OS noise
In Linux, four primary execution contexts can interfere with a workload: non-maskable interrupts (NMIs), maskable interrupts (IRQs), softirqs (deferred IRQ activities), and threads. Linux’s execution contexts are characterized by the following rules (see “A thread model for the real-time Linux kernel,” RHRQ 2:3 for more):
- R1/R2: The per-CPU NMI preempts IRQs, softirqs, and threads; once started, it runs to completion.
- R3/R4: IRQs can preempt softirqs and threads; once started, it is not preempted by another IRQ.
- R5/R6: Softirqs can preempt threads; once started, it is not preempted by any other softirq.
- R7: Threads cannot preempt the NMI, IRQs, and softirqs.
As the HPC workload runs in the thread context, it can suffer interference from all execution contexts, including other threads.
Measuring the operating system noise in Linux
There are two types of tools to measure the operating system noise in Linux: workload based and trace based. Workload-based tools generally run microbenchmarks with a known duration, and they measure the difference between the expected duration of the microbenchmark and the actual time needed to process it. While effective in defining the amount of operating system noise that a workload might suffer, workload-based tools cannot pinpoint the root causes of the OS noise.
Trace-based methods leverage Linux kernel tracing features to identify the root cause of operating system noise. However, these trace-based methods do not account for how workloads perceive the noise.
Unlike previous work, the osnoise tool proposed in this article takes the best of both workload-based and trace-based methods, pointing to the root causes of the operating system noise while accounting for how the workload perceives the noise.
The osnoise tracer
The Linux osnoise tracer is controlled via the ftrace interface. The osnoise tracer has two components: the workload component and the tracing component.
The osnoise tracer uses per-CPU kernel threads to simulate an HPC workload. Each thread runs periodically for a predetermined runtime. Each osnoise thread works by reading the time in a loop to detect the time stolen from its execution. A new noise sample is collected when it detects a gap between two consecutive readings higher than a given tolerance threshold. The user can adjust these and other parameters of the osnoise workload via ftrace’s interface.
The osnoise tracer leverages the current tracing infrastructure in two ways. It adds probes to existing tracepoints to collect information and a new set of tracepoints with preprocessed information.
At the end of every period, the osnoise workload thread prints a summary containing the amount of noise observed during the current activation, the percentage of CPU time available for the tool, and the maximum single noise observed. The workload threads also print statistics about the noise sources from NMI, IRQs, softirqs, and threads. Figure 2 shows an example of the trace output.
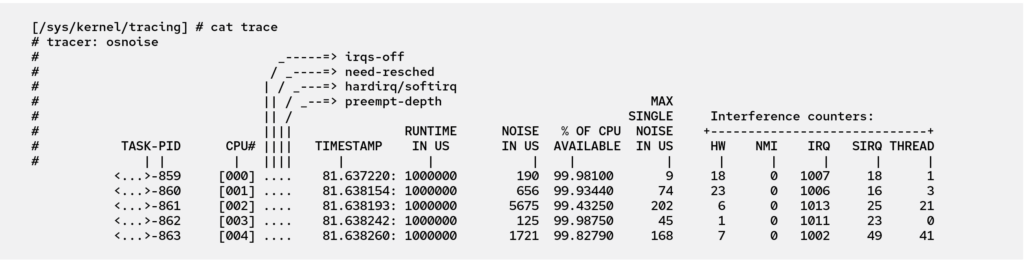
Figure 2. osnoise tracer summary output from ftrace interface
While Linux has tracepoints that intercept the entry and exit of NMI, IRQs, softirqs, and threads, the manual interpretation of these events is tedious. It requires a large tracing buffer and higher overhead because of the amount of data and might lead to the wrong conclusion if any error is made by the user while analyzing the trace.
The osnoise tracer leverages these tracepoints by attaching a probe to all entry and exit events producing an optimized output. The osnoise tracer adds a single event for each Linux task abstraction, stores the data in the kernel, and creates a single and concise event with all data processed.
Figures 3 and 4 compare regular kernel events and those parsed and generated by the osnoise tracer. The osnoise tracer events have all the necessary information for the direct interpretation of the data while reducing the amount of data written to the trace buffer.
In addition to printing the events reporting the amount of noise generated by each of the Linux task abstractions, the osnoise tracer can also print a trace event anytime a sample read of the clock detects a time gap longer than the minimum threshold. The last line in Figure 4 presents an example of this tracepoint, named sample_threshold. In the example, the detected osnoise was 1,414,624 nanoseconds long. Because the osnoise workload and tracer are aware of one another, the tracer can precisely define how many operating system interferences occurred between each clock read. This data also reports four interferences in the example, meaning that the four previous events were the root cause of OS noise. Further examples of root cause analysis and details about the internals of the tracer are provided in the full paper and the osnoise tracer Linux kernel documentation.
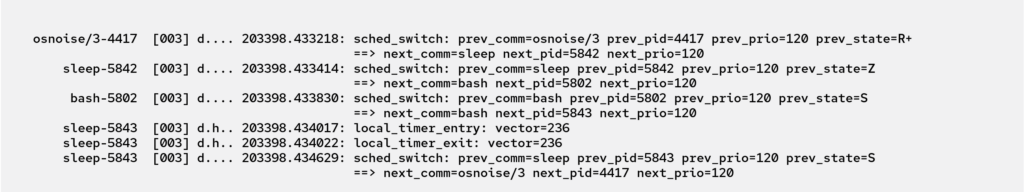
Figure 3. Example of tracepoints: IRQ and thread context switch events read from ftrace
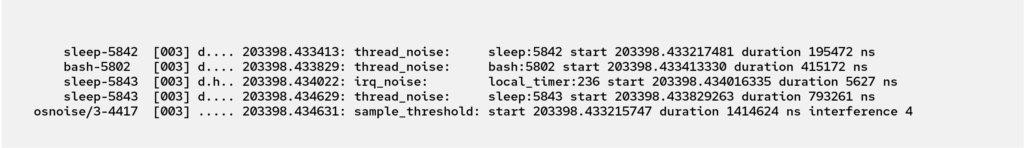
Figure 4. Example of tracepoints: osnoise events read from the ftrace interface with equivalent data highlighted
RTLA osnoise
The rtla (real-time Linux analysis) is a toolset provided along with the Linux kernel, and it provides an easy-to-use benchmark-like interface for the osnoise tracer. The rtla documentation can also be found in the Linux kernel documentation.
Experimental results
This section reports on osnoise usage for the measurement and trace of a system. The system is a workstation with an AMD Ryzen 9 processor, with 12 cores/24 threads. The system is configured with a Fedora Linux 35 server and runs the kernel 5.15 patched with the PREEMPT RT patchset. The rtla osnoise tool collects a summary of the OS noise and a histogram of each noise occurrence.
The system ran with four different setups. The first configuration of the system considered has no tuning applied and is named As-is. The system is said to be tuned when the best practices for CPU isolation are used. In this case, CPUs {0, 1} are housekeeping, and CPUs {2, . . . , 23} are reserved for osnoise workload execution. By default, osnoise workload threads run with the default’s task priority (SCHED_OTHER with 0 nice). However, it is common for NFV users to set a real-time priority for the workload. Additional experiments have been performed with osnoise threads running with real-time priority SCHED_FIFO:1 to evaluate this specific scenario. All tests run for six hours.
Percentage of noise
Figure 5 shows the percentage of noise observed on each of the four setups.
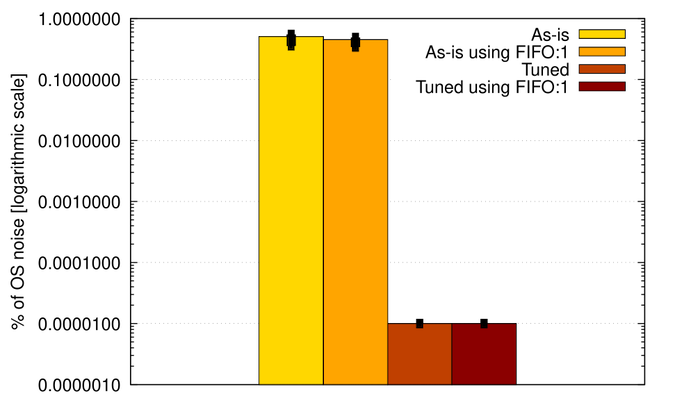
Figure 5. Average percentage of OS noise observed by the workload on different scenarios. Error bars represent the range between minimum and maximum percentages.
The maximum observed total noise was 0.5484% with the system As-is, while the minimum was 0.00001% for both Tuned cases.
OS noise occurrence
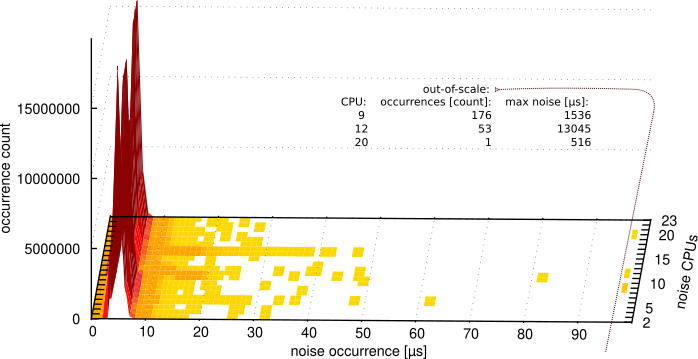
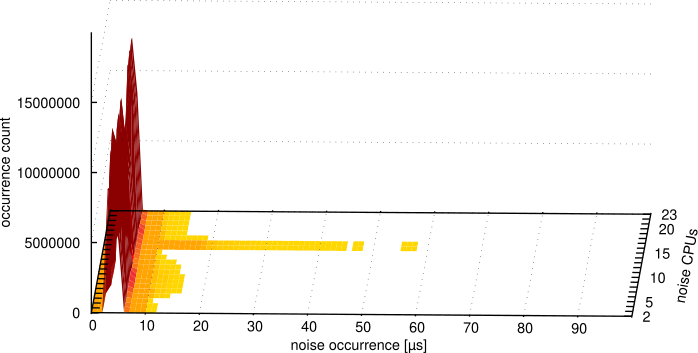
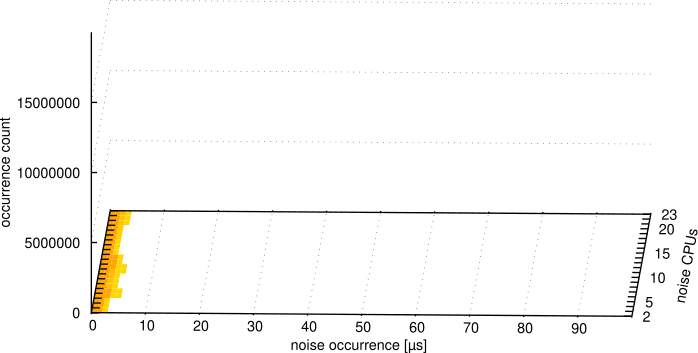
An experiment has been conducted for all setups collecting a histogram of each detected noise occurrence. This experiment is important for the NFV use case because a single long noise occurrence might cause the overflow of queues in the network packet processing. The results are presented in Figures 6a-f, which represent osnoise noise occurrence per-CPU histogram under different system setups, mixing CPU isolation tune and real-time priority for the workload (less noise occurrence and less occurrence count is better).
With this experiment, it is possible to see the main problem of using the system As-is in Figure 6a. The osnoise workload detected 230 out-of-scale noise samples, with the maximum value as long as 13045 µs. Figure 6b also shows that using FIFO:1 in the system As-is represents an easy-to-use option to reduce the maximum single noise-occurrence value. Because the workload causes starvation of non-real-time threads, these threads are migrated to the CPUs with time available for them to run.
As-is using FIFO:1, however, has two significant drawbacks compared to the Tuned options with or without using FIFO:1 in Figures 6c and 6d. The first is the high count of noise occurrences. The Tuned experiment includes the nohz_full option that reduces the scheduler tick and its consequences. Another difference is the tail latency, which is lower in the Tuned cases. The results with the system Tuned in Figures 6c and 6d show that the tune dramatically changes the entries and duration of each noise occurrence compared to the system As-is. Figures 6e and 6f have been added to visualize the Tuned cases better.
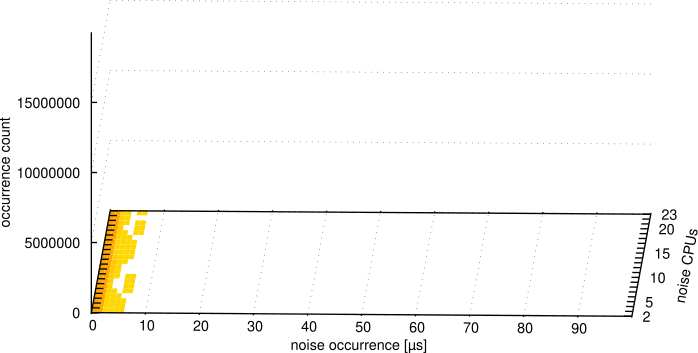
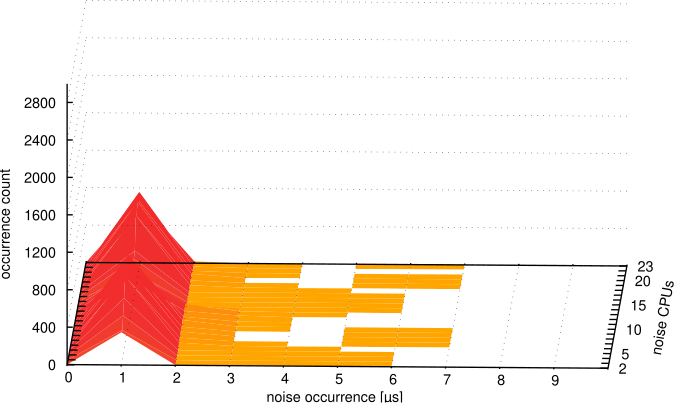
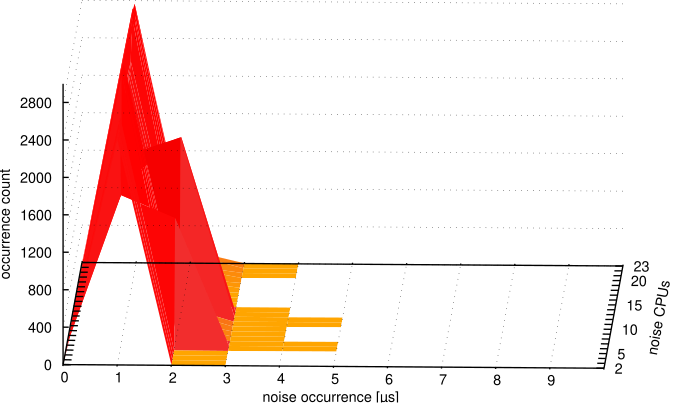
The Tuned kernel was able to deliver consistent results, while the kernel Tuned using FIFO:1 was able to provide below five µs maximum single noise occurrence. That is because the real-time scheduler deferred background OS activities that run as threads. However, the overall noise is higher when using FIFO:1. The reason behind this is a side effect of the starvation caused by busy-loop tasks running with FIFO priority.
It is worth noticing that these results are only valid for this hardware and setup. Any difference in the kernel and the hardware might change these values, thus the importance of an easy-to-use tool.
Remarks
The osnoise tool puts together the tracing and the workload, providing precise information at low overhead by processing and exporting only the necessary information for pointing to the root causes of the latency, serving as a good starting point for the investigation.
The experimental results show that the tool can serve as both a tracer and a benchmark tool, facilitated by using the rtla osnoise interface to collect data. It also shows that Linux can deliver extremely low OS noise. But more importantly, the tool can follow the kernel, providing results in the desired scale. Both the osnoise tracer and the rtla osnoise interfaces are an integral part of the Linux kernel, thus accessible to the entire Linux user base.
Note: This article is a summary of the paper “Operating system noise in the Linux kernel,” published in IEEE Transactions on Computers, Open Access.