


























Meet netstacklat, an open source eBPF tool developed with university researchers to provide critical visibility into host network latency and enable faster response times.
Any application that communicates across the network (which today is most applications) is impacted by network latency, with high latency translating directly to worse application response times, which in turn leads to degraded quality of experience for users of the application. Network latency has typically been associated with long network routes or packets getting stuck in large queues at the bottleneck link. However, as higher network capacities have outpaced the development of end host resources, the bottleneck in the network is increasingly shifting towards the end host itself.
While researchers have spent significant effort investigating and identifying latency sources in the end host network stacks, there remains a lack of tooling to monitor this latency. Service providers therefore remain blind to the extent to which host latency impacts their service response times and are unable to determine whether latency issues stem from their network or the servers themselves. To enable continuous monitoring of host network latency in production systems, we have therefore developed netstacklat. Visibility provided by netstacklat allows service providers to pinpoint if host network stack latency is degrading response time and isolate network-level performance issues.
Industry-academia collaboration
The development of netstacklat is part of a long-term collaboration between Red Hat and Karlstad University. As part of the project “Building the next generation of programmable networking—powered by Linux,” we have already looked at how we can use eBPF to continuously monitor network latency across internet connections. That work has been adopted by LibreQoS, a platform used by hundreds of internet service providers around the world, now monitoring the latency for millions of connections.
Building on this prior experience, we move our attention to monitoring the latency within the end host itself. Our solution, netstacklat, once again employs eBPF to achieve low overhead while remaining fully compatible with the Linux network stack. As with prior work, we have upstreamed our code to the bpf-examples repository, making it freely available for others to use and build upon. We are working on adding netstacklat to libbpf-tools, allowing it to be packaged together with a wide range of powerful eBPF-based observability tools.
A slightly modified version of netstacklat has already been deployed fleetwide at Cloudflare, keeping track of how long it takes before requests start being processed. We are currently investigating different opportunities to integrate netstacklat with Red Hat’s observability solutions (see “Boosting speed: Use eBPF and netstacklat to troubleshoot latency” on the Red Hat Developer blog). We will also present our paper “Waiting at the front door: Continuous monitoring of latency in the host network stack” at the highly regarded ACM Internet Measurement Conference (IMC ’26) later this year.
The kernel network stack
The Linux kernel network stack represents incoming packets using a data structure called (for historical reasons) a socket buffer, or SKB. When a network device receives a data frame, the driver constructs a SKB to represent the packet (or attaches the frame data to an existing SKB) and submits the SKB to the kernel’s network stack for processing.
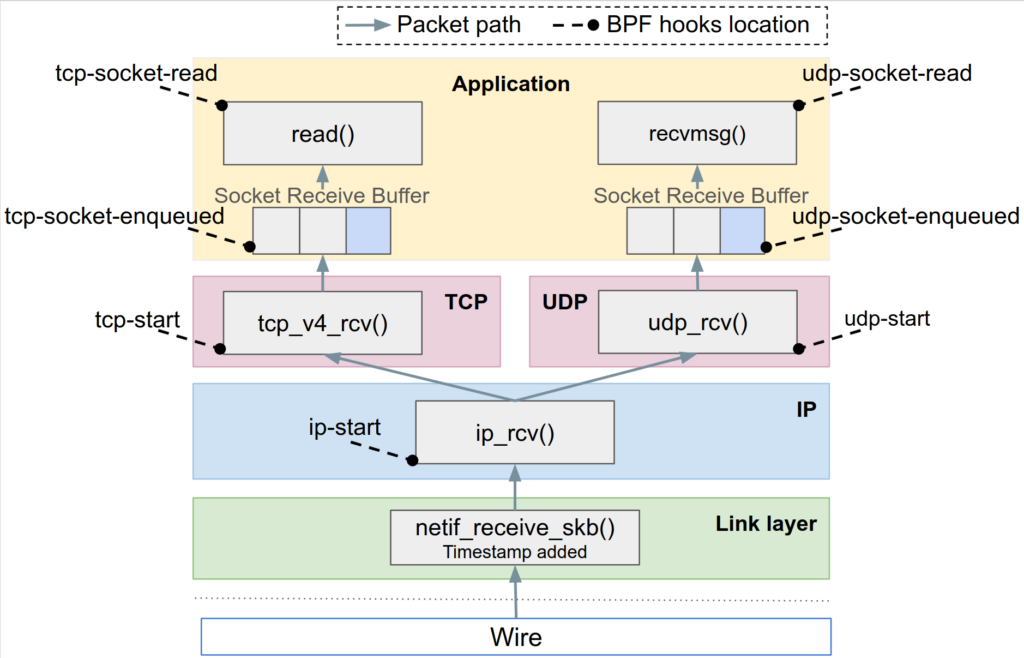
The path the packet takes through the core networking stack is illustrated in Figure 1, which also shows at which points netstacklat measures the latency. The netif_receive_skb() function is the entry point of the network stack, called by the driver code. Protocol-specific functions then process each protocol layer of the packet. For the common TCP and UDP protocols, the packet is ultimately enqueued into the socket receive buffer of an application, where it is kept until the application reads the data.
Design of netstacklat
With netstacklat, we want to monitor how latency builds up as SKBs traverse the kernel network stack, from the start of packet processing until the application reads the data. To achieve this, we use eBPF programs to observe packets at several strategically selected points in the kernel and record the latency distribution at each point.
There already exist several open source tools that utilize eBPF to monitor SKBs in the network stack, such as pwru (developed by Cilium) and retis (developed by Red Hat engineers). What sets netstacklat apart is that instead of reporting the timestamp for each probe point to a user space agent, netstacklat calculates and aggregates the latency directly in the eBPF programs. As detailed in the next section, this drastically reduces the overhead for netstacklat, making it feasible to continuously monitor the network stack latency in production.
To efficiently calculate the latency in the eBPF program, we make use of Linux’s capability to timestamp incoming packets early in the network stack (SOF_TIMESTAMPING_RX_SOFTWARE), as shown in the bottom of Figure 1. By using the SKB receive timestamp as a reference point, we can determine the time an SKB has spent in the kernel network stack at any point by taking the difference between the current time and the SKB timestamp. We then aggregate the obtained latency value into a power-of-two histogram stored in an eBPF map. We have made sure the data format is compatible with ebpf_exporter, which makes it easy to expose the netstacklat latency data as Prometheus metrics.
netstacklat currently monitors latency at the following four layers of the network stack for TCP and UDP traffic (also shown in Figure 1):
- ip-start: The point at which the SKB has reached the start of IP layer processing. Latency at this point comes from early parts of the network stack processing, such as VLAN and traffic control (tc) handling.
- udp-start and tcp-start: The SKB has reached the start of UDP or TCP processing. Latency at this point includes IP-layer processing, such as routing and the Netfilter firewall subsystem, in addition to the latency from
ip-start.
- socket-enqueued: The SKB has now been enqueued to the application UDP or TCP socket. This is the end of network stack processing, and the SKB payload is now ready to be read by the application. Latency here includes the UDP or TCP layer processing, as well as the latency from
udp-startandtcp-start.
- socket-read: In addition to the network stack latency from the socket-enqueued probes, the latency here also includes any additional delays before the application reads the data from the socket. This may include delays from the application being scheduled to run on a CPU, or the application performing or waiting on other tasks before attempting to read from the socket.
By capturing network stack latency at these four layers, netstacklat can break down where in the network stack significant latency increases occur. As each probe point reports the cumulative latency up to that point, this breakdown should be performed top-down. If, for example, tcp-socket-read latency is high and tcp-socket-enqueued is low, it indicates an issue at the application layer. Meanwhile, if tcp-socket-enqueued and tcp-start are also high while ip-start is low, it indicates that the issue is within the IP layer.
Testbed experiments
We evaluate netstacklat in a testbed where we use it to monitor the latency in an nginx server as we run a HTTP load generator against it. Figure 2 shows how the network stack latency at the four netstacklat layers grows as we increase the number of concurrent flows with back-to-back requests. We can see that the latency across all layers increases with the number of concurrent connections up to 50 connections. While the large (logarithmic) scale for the y-axis might make the increase for the earlier ip-start, tcp-start, and tcp-socket-enqueued look small, the average latency at 50 or more connections is at least twice as high as for the single-connection scenario. Past 50 concurrent connections, the time it takes the kernel to deliver the SKB to the application socket no longer increases. However, the tcp-socket-read latency, measuring the time until the nginx application actually reads the request from the socket, continues to grow as increasing numbers of connections create a large request backlog at the application layer. The average time until nginx can start processing the request thus increases from less than 10 microseconds with a single connection to over 100 milliseconds at 4000 concurrent connections.
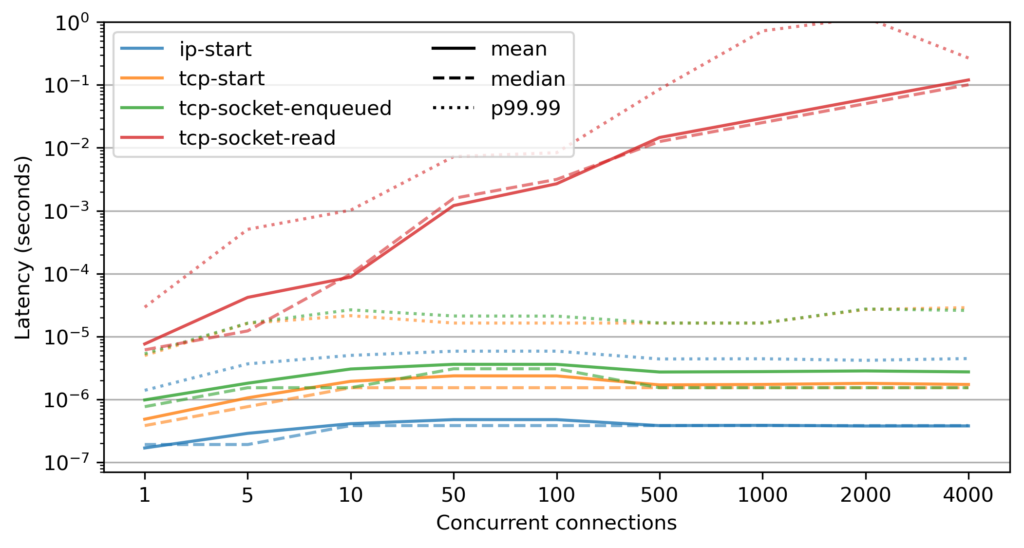
It is also worth noting that there is a long latency tail at all of the layers, even the early ip-start. In Figure 2, the 99.99th percentile latency (dotted lines) is typically around an order of magnitude higher than the median latency, even in the lightly loaded single-connection scenario. Across a larger set of workloads we have tested, we have observed maximum latencies being more than three orders of magnitude higher than the minimum latencies at each layer. In extreme cases, this may translate to it taking over 30ms for the kernel to deliver an SKB to the socket, comparable to the end-to-end network latency for a (LEO) satellite link.
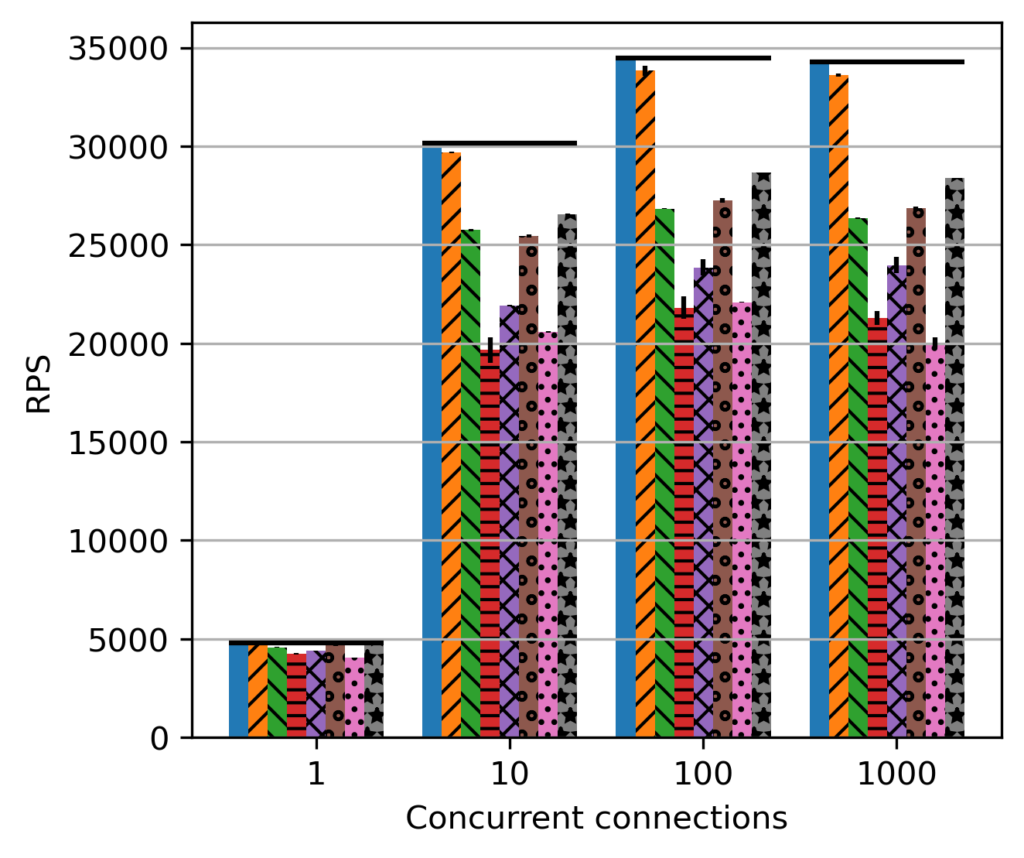
We also look at how the overhead from netstacklat compares to several other tools that can monitor the host network stack latency, namely latrace, Kyanos, pwru, and retis. The flexible pwru and retis tools can be configured to monitor any kernel function receiving an SKB. Here, we test them both with their default (all SKB-related functions for pwru, and 25 kernel functions in the generic profile for retis) as well as using the same (smaller) set of kernel functions probed by netstacklat (pwru-netstacklat and retis-netstacklat in the results). This results in six different monitoring setups.
Figure 3 shows the end-to-end performance that our testbed delivers under each of the six monitoring setups, as well as the baseline performance without any monitoring. Under the heavily loaded scenarios with 100 or 1,000 concurrent connections, netstacklat reduces the requests per second (RPS) throughput with less than 2% and does not inflate the 99th percentile response time by more than 6% compared to the baseline. In contrast, the other tools reduce RPS by between 17-42% and more than double the 99th percentile response time. Of the evaluated tools, netstacklat is the only one with sufficiently low overhead to not greatly impact the performance in heavily loaded scenarios, and therefore the only suitable alternative for continuous monitoring.
RPS 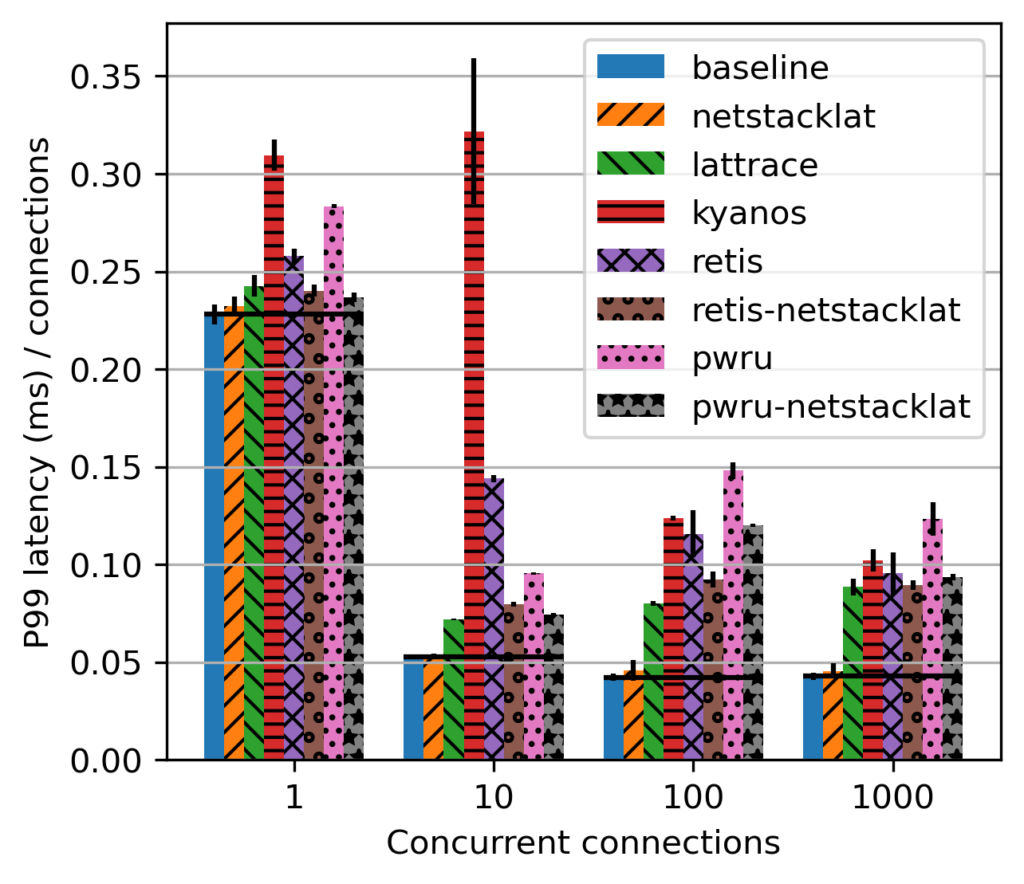
99th percentile response time
Figure 3. How overhead from monitoring tools impact end-to-end performance
Cloudflare deployment
The netstacklat tool has been developed as an open source utility throughout this project. Like many other open source projects, this has led to collaboration across organizational boundaries, highlighting how the open source collaboration model benefits the entire ecosystem. As part of this collaboration, netstacklat has been successfully deployed on all servers in Cloudflare’s global CDN network. As Cloudflare already uses ebpf-exporter to collect various eBPF-powered metrics, netstacklat could relatively easily be added to their monitoring pipeline. For this deployment, we focus on the full delay until requests are read by their nginx services, and therefore use only the tcp-socket-read probe and limit the monitoring to the nginx-related cgroups to minimize overhead.
In Figure 4, we show a semi-controlled experiment, where the load balancer was configured to gradually increase the traffic to a server (in steps to 4,000, 4,500, 5,000, and 6,000 RPS at the times indicated by the dashed vertical lines). Here, we can see how the tail latency for the time before the nginx-ssl instance starts processing requests (tcp-socket-read) increases roughly proportionally to the request rate. In this instance, the network stack and nginx are not the primary bottlenecks, and a 95th percentile latency below 1ms is unlikely to have a large impact on the end-user perceived delay.
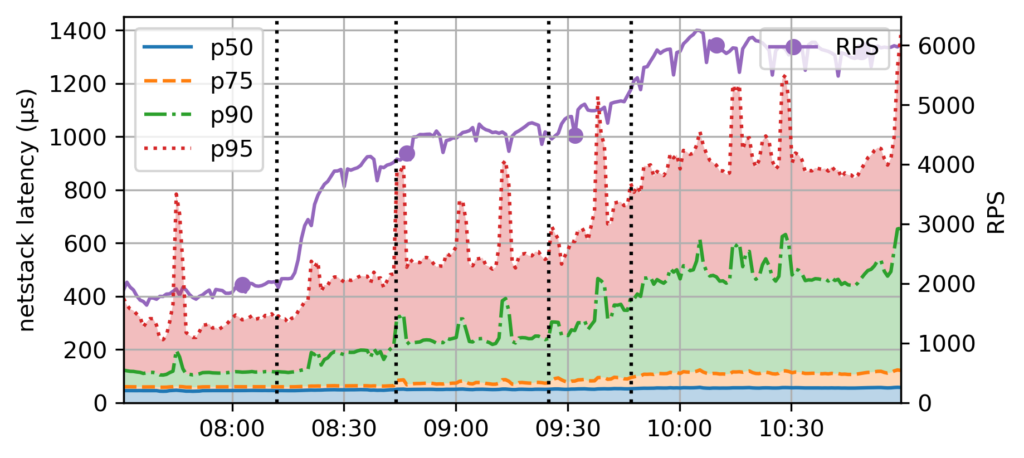
Bottlenecks can shift, however, and netstacklat has also helped identify instances where the host network latency on some servers increased drastically, with median latencies reaching into the multi-millisecond territory. In that way, netstacklat helps Cloudflare keep track of where all the requests they serve spend their time. We found the overhead cost for this additional monitoring to be only around 0.04% CPU utilization during peak hours at Cloudflare’s busiest location.
Future plans
As the networks get faster and resources are moved to the edge, the end host network stack will play an increasingly important role in ensuring low end-to-end network latency. With netstacklat, we make it possible to continuously monitor how long packets spend waiting on the Linux network stack and applications to process them.
There is, however, still room for improvement. netstacklat currently only measures the time from the start of the Linux network stack, but studies have shown that significant latency can arise already in the NIC-CPU interconnect. By using the hardware timestamps that many modern NICs can provide, we could extend netstacklat to measure the total time since the packets first arrive at the NIC. It would also be useful to complement netstacklat’s high-level latency distributions with detailed traces to simplify root cause identification, and make the selection of points to probe more flexible, similar to pwru and retis.
As netstacklat is open source, it can also benefit from the wisdom and experience of the open source community. If you have an idea for how to improve netstacklat, please let us know! Or better yet, implement it and open a pull request.
Note: RHRQ includes articles that discuss technologies under active development in upstream open source communities, at universities, and at Red Hat. We want to note that unless otherwise stated, the technologies and how-tos shared here aren’t part of supported products, nor promised to be in the future.