


How do you turn a research project into an industry tool? Learn how the creators of Perun built a better performance analysis toolkit then brought it from academia to real-world implementation.
Everyone has a horror story about poor performance in a continuously evolving product. Managing the performance of reasonably complex software is simply a difficult task. With large software systems, things get even more entangled. The Linux kernel, web browsers, operating systems, or databases—these code bases all exceed millions of lines of code. The Linux kernel, in particular, has been developed for several decades by tens of thousands of developers, and it has a constant stream of new kernel versions every day, both in the upstream and in the distribution-specific branches, such as Red Hat Enterprise Linux (RHEL).
This article introduces Perun, an open source, lightweight Performance Version System that tracks performance profiles corresponding to different versions of underlying projects. Perun began in 2016 as a project at the Brno University of Technology with a small team of researchers aimed at developing a performance analysis tool suite to help performance engineers and developers working on complex user-space software. In 2023, the BUT team joined forces with Red Hat Research to enhance Perun with kernel-space analysis capabilities.
Perun is basically what every performance engineer needs in one place: tools for measuring metrics, storage of results, interpretations of performance data, and a link between performance results and different versions of a software project. Perun is designed to support a variety of architectures and workflows. In this article, we will describe how we worked with the Red Hat Kernel Performance Engineering Team in Brno, responsible for RHEL kernel performance, to develop Perun further. However, this is merely one use case, and we encourage others to try Perun.
Why Perun?
Whenever a new RHEL or ELN kernel version passes functional testing, the performance team has to evaluate its performance, and they have to do it quickly. The evaluation is based on running a set of benchmarking suites on new kernel versions and then analyzing potential performance changes compared to previous versions. The goal is to locate drops in performance and the root causes of these drops. Much of this process involves manual inspection and comparison of performance data, metrics, statistics, and other reports (e.g., the flame graphs invented and popularized by Brendan Gregg).
In many cases, performance engineers have to inspect the environment as well: the boot, system, or hardware configurations—such as the set of enabled mitigations for CPU vulnerabilities—which are often scattered in different reports and logs. This manual process is tedious and time consuming, and it cannot be easily automated. It requires a performance engineer’s domain knowledge and a deep understanding of the kernel. Extending the performance engineer’s toolbelt is undoubtedly welcome.
A gentle introduction to Perun’s architecture
Perun’s core acts as a lightweight database that stores compressed performance results and maintains their link to concrete function changes (represented as software versions—for Git, this corresponds to pairs of a branch and a commit) identified by hashes. Technically, this is realized similarly to how it works in Git: Perun resides in a parallel file system next to the version control system. Moreover, Perun provides a suite of tools (both experimental as well as wrappers over existing tools) to help with collecting, managing, and interpreting performance data.
For kernel analysis in particular, we have implemented two profilers. kperf is based on the well-established perf tool that samples the kernel stack together with traces. Ktrace uses the libbpf library to trace the kernel function executions precisely. (Note that this is highly experimental, as tracing every function call in the kernel provides both considerable overhead and potential event loss due to the vast number of traced events.)
However, Perun offers much more: its architecture is modular and can be extended with new experimental tools quite easily. In past years, it has served as a platform for experimenting with other performance aspects, including performance fuzz-testing, non-parametric performance models, performance regression detection techniques, and an energy-consumption profiler, among many others. Perun is implemented in Python; it is still in development and supports Python versions ranging from 3.9 to 3.13. You can install Perun from the PyPI repository using pip install perun-toolsuite.
The Red Hat use case
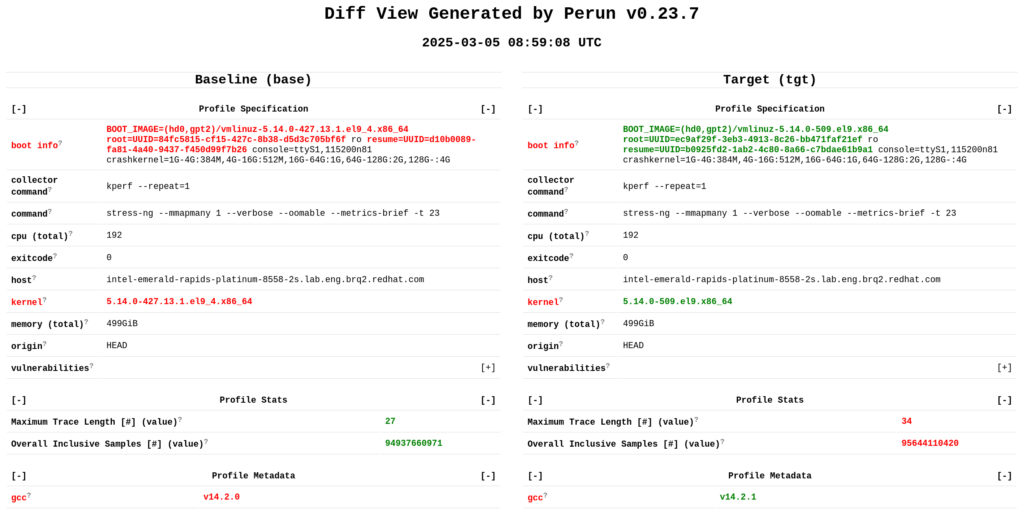
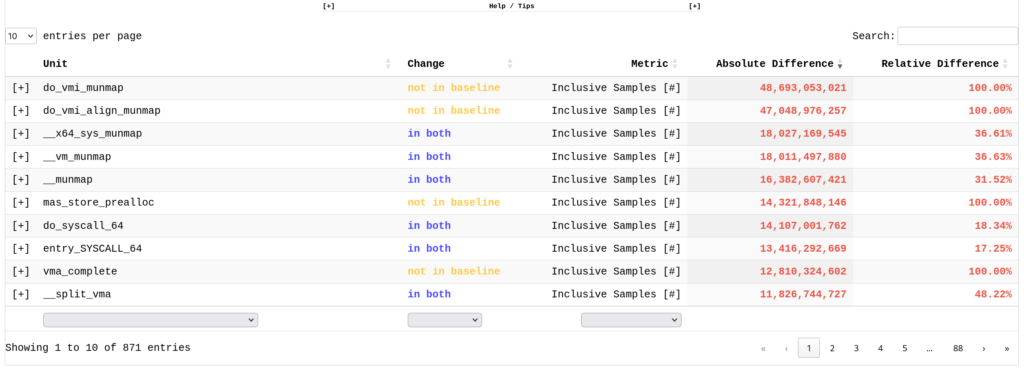
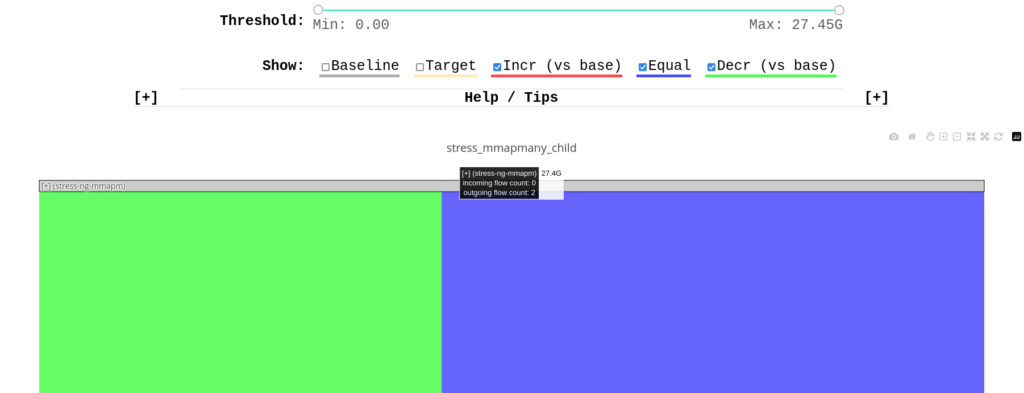
For the Red Hat team, we integrated Perun as part of the benchmarking toolchain mainly to generate reports highlighting differences between different performance profiles of different kernel versions. Our goal was to create self-contained reports with intuitive, interactive, and compact visualizations that make it easier to interpret performance results and quickly drill down into functions with suspicious performance behavior. Figures 1 to 4 show the four main parts of the Perun report.
Perun displays general context information about the baseline and target profiles being compared. It is also possible to provide user-defined metrics that will be compared here (Figure 1). Next, interactive flame graphs and flame graph differences are displayed (Figure 2). Additional details are available in a tabular view under the Browse All tab (Figure 3). At the bottom, an interactive Sankey graph is rendered, which allows the user to further explore and filter the call stack and see the differences in the number of collected baseline and target samples (Figure 4).

The integration of Perun in the kernel performance process gave us encouraging results: Perun has already helped the Kernel Performance Engineering Team pinpoint the source of several performance results. The root causes are rich: excessive calls to XFS file system functions, needless calls to SELinux policy functions (see Figure 5), nonoptimally designed barriers, or inefficient mitigations of some recent kernel vulnerabilities.

Figure 5 illustrates that the function has been seen in 34% more call stack samples in the target profile compared to the baseline. Moreover, the number of exclusive (also known as self) samples is 127% higher in the target, as indicated by the red exclamation marks (not part of the Perun visualization). This means that the selinux_socket_sendmsg function likely spends more time directly in its code, as opposed to other functions called from it. In this particular case, it thus becomes a candidate for further analysis by performance engineers.
Overall, Perun makes it easier and faster for performance engineers to identify the source of performance degradations. Based on the Kernel Performance Engineering Team’s experience using Perun so far, we estimate that, on average, Perun saves approximately four hours out of a typical 8-hour process to examine and triage new performance bugs thanks to the newly introduced automation of generating more verbose and self-contained difference reports. Moreover, engineers can more precisely locate the source of performance drops in more cases than before, giving kernel developers more context information and fixing more performance bugs.
In addition, Perun’s self-contained and highly interactive reports make exchanging results easy. This is especially important in global companies where engineers work in different time zones. Last but not least, with Perun, engineers no longer have to wait for the hardware to become available and can instead analyze performance data offline. Performance engineers have welcomed the new addition, and we are extending the set of Perun features based on their feedback to help them even more.
We helped uncover some performance issues and changes at Red Hat, including changes in network performance between early versions of RHEL-10 and RHEL-9.4. Since RHEL-10 uses kernel 6.12 and RHEL-9 kernel 5.14, reviewing changes in kernel code is virtually impossible. Perun’s intuitive visualization uncovered a 15% slowdown caused by Intel BHI mitigation influencing SELinux handling.
After the kernel developers resolved this problem, we started to uncover more subtle changes. The first was newly introduced synchronization barriers in the code, which had a lot of potential for performance improvements and allowed performance gains in the 5-10% range. Finally, we found performance issues in low-level assembler functions on some platforms that copy data between buffers. Since then, we have provided Perun reports along with every kernel test result. This helped communicate results to the developers and made the reported performance bottlenecks obvious.
Integrating Perun
To integrate Perun into Red Hat processes, we separated the data collection from post-processing. We have a dedicated server running Perun and integrating results collected from individual test machines. Systems under test run a different kernel and/or have different configurations and environments. In our initial setup, we deployed Perun to each new machine and used our dedicated kernel profilers (based on perf or BPF). The test environment spans different OS versions, from RHEL-8 to RHEL-10 up to CentOS Stream, and maintaining Perun instances with respect to ever-changing machine dependencies and requirements was not feasible. For this reason, we now instead rely solely on remote profiling using perf (which itself is widely supported by kernels) and import the raw data into Perun on our dedicated server.
The dedicated server with Perun’s instance maintains a database of these results, preserving the context of profiling: the actual data, selected statistics, environment, and machine specification, list of vulnerabilities, and other things necessary to debug the root cause of performance degradation. The server then computes a comparison of two selected kernels on demand, generating our proposed performance reports. The functionality is available from the internal dashboards. This lowers the barrier to adopting Perun by offering the following alternative lightweight workflow, where Perun acts as a front-end for performance data collected by perf with additional environment context:
- As soon as the new version of the kernel passes functional tests, performance tests start automatically on a wide range of different hardware configurations. For some tests, performance data are automatically collected. For others, performance data can be collected on demand. The limiting factors are the runtime,
perftool overhead, and disk space required to store allperfprofiles. - Quick statistical performance checks are performed, along with automatic machine-learning-enhanced reports tagging, to assess whether performance is degraded for any pair of kernels or configurations.
- A performance engineer either reviews the generated Perun reports, if they are already available (only for selected benchmarks), or schedules specific benchmark runs with perf data collection enabled that will automatically generate the required Perun reports. The engineer examines the reports to identify potential sources of the reported degradation. Flame graphs are handy for gaining a quick overview of performance changes.
- Once a potentially problematic function is identified, the tabular report and Sankey graphs can be used to further assess the severity and the extent of the change. When a concrete function’s performance is deemed suspicious, we can start comparing results with changes in the kernel code or contact Kernel Developers for further consulting.
- Once the performance problem is confirmed, an engineer can open a Jira ticket to track the issue. Here, the standalone self-contained Perun reports are convenient for effortlessly describing the problem and sharing performance testing results.
Academia meets industry: challenges and obstacles in deploying a research tool in practice
Making a research tool created in academia usable by engineering teams in industry often entails numerous challenges and obstacles.
Presentation of results: Researchers developing an experimental tool typically do not care much about how their tool presents results to users. As (usually) the only users of their own tools, they are used to deciphering slightly cryptic command line output, text logs, or files scattered in different directories. Perun was, in some respects, no different from other research tools. Although Perun supports various visualizations of performance results, there was no concise and self-contained report summarizing the performance of a specific project version, or how it compares to other versions. However, as we quickly learned, presenting results concisely is one of the most important aspects of a research tool striving to make its way into the real engineering world.
Scalability: Most research tools are being developed by a handful of contributors, so there usually are not enough hands to address all the potential performance or scalability issues. Immediately after Perun was integrated into the Red Hat performance analysis toolchain, the Kernel Performance Engineering Team discovered that Perun does not scale well with the amount of performance results they generate each day. Luckily, we managed to quickly pinpoint and hotfix issues stemming from costly, eager imports of third-party libraries by adopting the SPEC 1 recommendation and making Perun scalable enough to handle the workload. Similar scalability issues often hinder the adoption of many promising research tools in practice.
Installation and distribution: As most researchers are aware, installing an academic tool can be a feat in itself. Before being deployed in Red Hat, installation from source was the only way to install Perun. This quickly became a pain point for Red Hat engineers, and the slightly obsolete, incomplete, or, at some points, confusing installation instructions certainly did not help. Since then, Perun has been made available as a package on PyPI, the most popular platform for distributing Python packages. However, the distribution and installation of Perun is still an ongoing challenge, with many more steps to go until Perun can be made more accessible to wider audiences through a more straightforward installation process, possibly using system packaging managers.
Applying research in new domains: In the past, we have introduced and later refined a new algorithm for diff analyses of performance results between two versions of the same software. Although this algorithm worked well for locating the sources of performance drops in user-space programs (such as CPython), using a tracing profiler, we found that the algorithm in its current form is not easily applicable for diff analysis of kernel-space performance profiles for multiple reasons: the Kernel Performance Engineering Team collects different performance data, the source code and call graphs are not always available to Perun, and the amount of changed code and functions between compared kernel versions is too large for the results to be useful to the person using the tool.
The general lesson is that applying existing research in new (or even just slightly different) domains is often a struggle for research tools—however, that struggle drives further research and leads to new solutions.
Future work on Perun
Perun is still being actively developed. We are gradually improving user experience based on feedback both from the Kernel Performance Engineering Team in Red Hat and from other kernel developers. We are also pursuing other new research opportunities focusing on industry and academic collaboration. We are now working on the following enhancements, among others:
More advanced and self-contained reports: We aim to improve the difference reports so that they become more informative, contain more advanced and interactive visualizations, and allow performance engineers to annotate reports with their own findings and insights. We believe that by making reports as self-contained as possible, we will be able to save even more of the time now spent on describing findings in emails or Jira tickets to colleagues.
New research challenges: We are also working on several new research challenges that emerged with the adoption of Perun in Red Hat. One of the main challenges is to analyze the differences between kernel performance profiles with widely dissimilar execution traces or call stacks, yet limited context data (such as detailed control or data flow) to provide accurate hints and suggestions regarding the likely source of performance drops. Moreover, we are interested in the efficient collection of more detailed performance data and metrics in kernel-space with tracing (e.g. with eBPF), which becomes particularly difficult when inlined functions and inlined assemblies are used extensively. Finally, we are considering training and/or leveraging AI models to assist performance engineers with root-cause analysis of performance bugs.
User experience: One of our goals is to make Perun more accessible to wider audiences, and improving Perun’s distribution and installation process will undoubtedly help with this task. We aim to minimize the number of core dependencies and provide modular installation for systems with tight dependency constraints. We also plan to package and distribute Perun through other packaging systems such as Fedora Copr, making installation easier. Lastly, we would like to improve the scalability and performance of Perun, making it more accessible for environments with limited time and memory resources.

Funded by the European Union under Grant Agreement No. 101087529 Views and opinions expressed are however those of the author(s) only and do not necessarily reflect those of the European Union or European Research Executive Agency. Neither the European Union nor the granting authority can be held responsible for them.